如何衡量特征的重要性
在机器学习任务中,好的特征选择对模型的优劣起到非常关键的作用。如何衡量一个特征的好坏和对最终模型的贡献程度是特征工程中必不可少的一环,本文记录了几种衡量特征重要性的手段作为笔记和参考。
决策树特征重要性衡量
决策树通过划分来将样本分离到不同的子树中,使得最终分支结点包含的样本尽可能属于同一类别,即“纯度”越来越高。
以“基尼指数”作为划分依据为例,数据集 $ D $ 的纯度可以表示为:
$ Gini(D) = 1 - \sum_{k=1}^{|y|} p_{k}^{2} $
当 $ Gini(D) $ 越小,数据集 $ D $ 的纯度越高。
假定选择了特征A使得在划分前后,数据集的纯度从 $ 0.6 $ 下降到 $ 0.3 $ ,则我们认为特征A对该树的重要度为 $ 0.6 - 0.3 = 0.3 $ 。
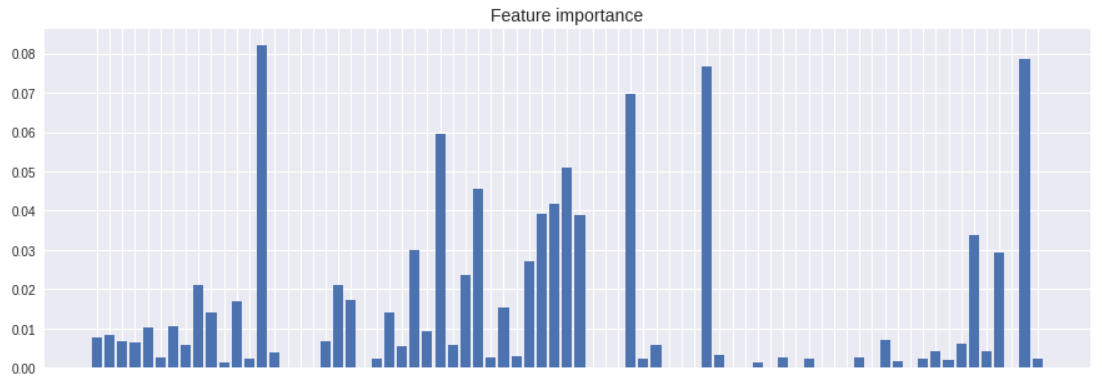
对于随机森林和XGBoost来说,将特征对每棵树的重要度求平均即可得到特征的重要度[1]。
import numpy as np
import pandas as pd
import xgboost as xgb
import matplotlib.pyplot as plt; plt.style.use('seaborn')

# 加载数据集
data = pd.read_csv('data.csv')

# 回归
model = xgb.XGBRegressor(max_depth=5, learning_rate=0.03, n_estimators=300)
model.fit(data.loc[:, (data.columns != 'label')], data.loc[:, data.columns == 'label'])

# 绘图
cols = data.columns.to_numpy()
cols = cols[cols != 'label']

plt.figure(figsize=(15, 5))
plt.bar(range(len(cols)), model.feature_importances_)
plt.xticks(range(len(cols)), cols, rotation=-90, fontsize=10)
plt.title('Feature importance', fontsize=14)
plt.show()
ROC曲线法
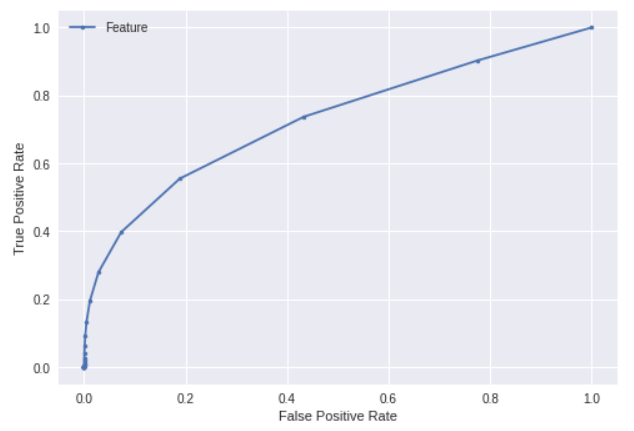
这个方法来自一位朋友,通过ROC曲线也可以分析特征和结果之间的关联程度。
from sklearn import metrics

y = data['feature1']
label = data['label'].apply(func=lambda x : 1 if x > 0.01 else 0)

# 数据规格化处理
std = y.std()
if std != 0:
    y = (y - y.mean()) / std

# 计算ROC
fpr, tpr, thresholds = metrics.roc_curve(label, y.to_numpy())

# 绘图
plt.plot(fpr, tpr, marker='.', label='Feature')
plt.xlabel('False Positive Rate')
plt.ylabel('True Positive Rate')
plt.legend()
plt.show()
对所有特征计算ROC_AUC可以得到特征重要性结果。
from sklearn import metrics

label = data['label'].apply(func=lambda x : 1 if x > 0.01 else 0)

# 分特征计算AUC
features = []
features_auc = []
for i in data.columns:
    if i != "label":
        y = data[i]
        std = y.std()
        if std != 0:
            y = (y - y.mean()) / std
            fpr, tpr, thresholds = metrics.roc_curve(label, y.to_numpy())
            auc = metrics.auc(fpr, tpr)
            features.append(i)
            features_auc.append(auc)
        else:  # 无效数据
            features.append(i)
            features_auc.append(0.5)

# 对结果进行修正
features_auc = [abs(x - 0.5) for x in features_auc]

# 绘图
plt.figure(figsize=(15, 5))
plt.bar(range(len(features)), features_auc)
plt.xticks(range(len(features)), features, rotation=-90, fontsize=10)
plt.title('Feature importance', fontsize=14)
plt.show()
可以看到和xgboost的特征重要度差异挺大,可能是因为用例的特征在非线性空间里面表现更好导致。
SHAP值法
SHAP值源自于博弈论,在机器学习中可以用于反应出每个样本中各个特征施加的影响力[2]。
import shap

ds_data = data.sample(100000)  # 需要降采样,数量级过大不能出图
explainer = shap.TreeExplainer(model)
shap_values = explainer.shap_values(ds_data.loc[:, (ds_data.columns != 'label')])
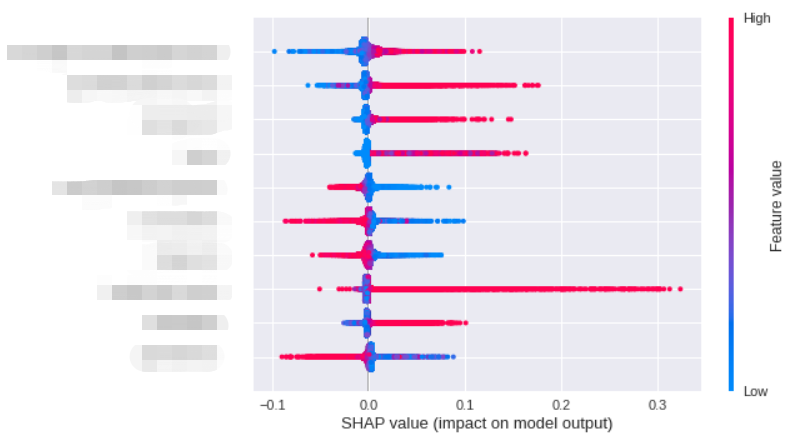
shap.summary_plot(shap_values, ds_data.loc[:, (ds_data.columns != 'label')], max_display=10)算法排序了最重要的几个特征,其中一个点代表一个样本,颜色越红说明特征的数值越大,蓝色反之。如果蓝色样本在<0部分集中,说明特征数值越小,对模型结果的副作用越大;同理如果红色样本在>0部分集中,则说明数值越大,对模型的正向作用越大。

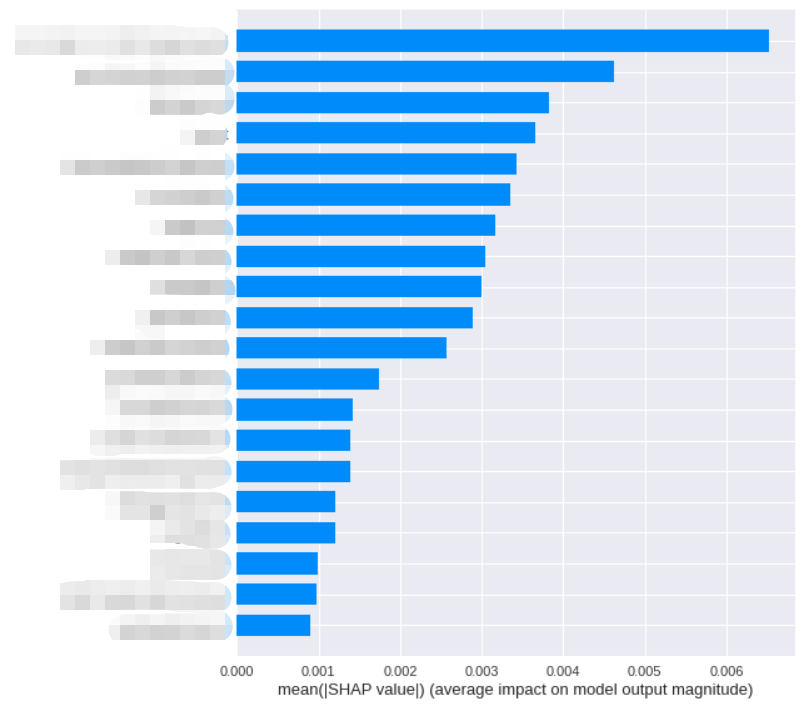
我们把对影响程度的均值作为样本的重要度,可以得到:
shap.summary_plot(shap_values, ds_data.loc[:, (ds_data.columns != 'label')], plot_type='bar')
合并输出结果
下面给出代码合并上面提到的几种方式给出最终的特征重要度:
import numpy as np
import pandas as pd
import xgboost as xgb
from sklearn import metrics
import matplotlib.pyplot as plt; plt.style.use('seaborn')
import shap


def calc_feature_importance_roc_auc(data, label):
    """
    计算特征重要性(ROC AUC)
    :param data: 特征数据
    :param label: 标签数据
    :returns: 特征重要性
    """
    # 分特征计算AUC
    features_auc = []
    for i in data.columns:
        y = data[i]
        std = y.std()
        if std != 0:
            y = (y - y.mean()) / std
            fpr, tpr, thresholds = metrics.roc_curve(label, y.to_numpy())
            auc = metrics.auc(fpr, tpr)
            features_auc.append(auc)
        else:  # 无效数据
            features_auc.append(0.5)

    # 对结果进行修正
    features_auc = [abs(x - 0.5) for x in features_auc]
    return pd.DataFrame(features_auc)


def calc_feature_importance_shap(tree_model, data):
    """
    计算特征重要性(SHAP)
    :param tree_model: 树模型
    :param data: 特征数据
    :returns: 特征重要度
    """
    explainer = shap.TreeExplainer(tree_model)
    shap_values = explainer.shap_values(data)
    shap_values_df = pd.DataFrame(shap_values)
    return shap_values_df.abs().mean(axis=0)


if __name__ == "__main__":
    # 读原始数据
    data = pd.read_csv('data.csv')

    # 训练XGB模型
    feature_data = data.loc[:, (data.columns != 'label')]
    label_data = data.loc[:, data.columns == 'label']
    model = xgb.XGBRegressor(max_depth=5, learning_rate=0.03, n_estimators=300)
    model.fit(feature_data, label_data)

    # 计算重要度
    feature_importances = pd.DataFrame({
        'feature': feature_data.columns,
        'roc_auc': calc_feature_importance_roc_auc(feature_data, label_data['label'].apply(func=lambda x : 1 if x > 0.01 else 0))[0],
        'shap': calc_feature_importance_shap(model, feature_data.sample(1000000)),
        'xgb': model.feature_importances_,
    })

    # 保存到文件
    feature_importances.to_csv('feature_importances.csv')